
Use Visier Data in Tableau
Create visualizations in Tableau by fetching data from Visier.
Access requirements
Profiles: Enterprise API User
Reach out to your administrator for access.
Overview
If you want to use your Visier data in Tableau Desktop or Tableau Server, you can use Visier's Tableau plugin to fetch aggregate and table data from Visier to create reports in Tableau. Visier users with the appropriate data security access can get data out of Visier to use in Tableau.
Note:
- Watch this video to see a demo of the Visier Tableau connector.
- For sample dashboards and stories, download Visier Tableau Sample Workbooks.
Prerequisites
- Have Tableau Desktop 2023.3 or higher or Tableau Server.
- Have a Visier tenant that contains data.
- Have a Visier user account. You can log in with your username and password or single sign-on (SSO) if your organization uses SSO.
- Have access to data in Visier. You can only bring Visier data into Tableau if your Visier user account is assigned data security access to that data. For more information about data security in Visier, see Data Security for a Permission.
- Retrieve a Visier API key. For more information, see Generate an API Key.
- Download the VisierData.taco file. The file allows you to connect to Visier from Tableau. For more information about the latest TACO file, see TACO file history.
Connect Visier data to Tableau
After completing the prerequisites, you're ready to connect your data to Tableau.
Step One: Move the TACO file into Tableau
|
Option |
Do this |
|---|---|
|
Tableau Desktop |
|
|
Tableau Server |
You must first move the Taco file into your Tableau Server application folder and restart Tableau Services. for example: tsm restart.
|
Step Two: Authentication
-
Do one of the following:
Option
Do this
Tableau Desktop
- Open Tableau Desktop.
- On the start page in the Connect pane, under To a Server, click More, and then select Visier Data by Visier from the list of connectors.
Tableau Server
- Connect to the Table Server console.
- On the Home page, click New > Workbook.
- In the Connectors folder, click Visier Data by Visier.
Result: The Connect Visier data to Tableau dialog appears.
-
In the Authentication section, select an authentication type and do one of the following:
Note: OAuth 2.0 authentication is not supported for Tableau Server.
Option
Do this
Secure Token
- Provide the following credentials:
- Vanity name: The vanity name in your Visier URL; for example, if your Visier URL is jupiter.visier.com, your tenant vanity name is jupiter.
- API key: Your Visier solution's API key; for example, YRggWt8z047rJPjyjxVZa. To get your API key, see Generate an API Key.
- Enter the username and password you use to sign into Visier.
- Click Login.
OAuth 2.0
- Provide the following credentials:
- Vanity name: The vanity name in your Visier URL; for example, if your Visier URL is jupiter.visier.com, your tenant vanity name is jupiter.
- API key: Your Visier solution's API key; for example, YRggWt8z047rJPjyjxVZa. To get your API key, see Generate an API Key.
- Click Login.
- On the Visier sign in page, provide your user credentials (username and password or SSO), and then click Sign in.
Result: If successful, the Query builder section opens.
- Provide the following credentials:
Step Three: Create a query to load Visier data
If authentication is successful, you can build a query to load data from your Visier solution.
Build your query using:
- The visual interface (Build Query)
- JSON. For code samples, see JSON query code samples.
- SQL-Like. For code samples, see SQL-like query code samples.
As you build your query, keep in mind you will only have access to the analytic objects that your Visier user account can access; for example, Employee and Employee Exit. After you select an analytic object, you can choose between an Aggregate or Snapshot query based on the visualization you want to create in Tableau.
- Aggregate: This aggregates data for a single object in Visier, usually across time. For example, you can perform a single aggregation to retrieve your organization's headcount over the last 12 months grouped by Location and filtered by Organization. Perform this query if you want to build visualizations similar to those in the Explore room.
- Snapshot: This returns a list of values for objects at a specific time. The values are not aggregated. For example, you can perform a snapshot query to retrieve the names of the female employees in your organization at a specific time. Perform this query if you want to build a visualization similar to Detailed View.
- Build your query in the Query builder section.
- Click Preview to see what data will be loaded into Tableau.
- If the data preview looks good to you, click Load.
Note: The Load option appears after you preview the data.
Result: The connector retrieves your data and imports it into Tableau as a data source named visier_data. We recommend that you rename the data source so you know what data you're working with.
- After you've connected to Tableau, do the following to load additional data:
- In Tableau, click Data > New Data Source.
- In the Connect Visier data to Tableau dialog, re-authenticate.
- Repeat steps 1 to 3 to load additional data you need to create your visualization in Tableau.
Aggregate query options
If you selected an aggregate query, you can set the following options to select the data that is loaded.
- Metric: All metrics associated with the object. For example, if you select Employee, you can then select metrics like Headcount or Absence Ratio. In a single query, you can select multiple metrics from the same analytic object. However, you will have to build another query if you want to load metrics from another analytic object.
- Filter by (optional): The attribute to filter the data by.
- Group by (optional): The attribute to group the data by.
- Time period type: The type of time period to measure data, such as Month or Quarter. Default is Month.
- Date: The time instant to query from.
- Update automatically: If Time direction is BACKWARD, use the start of the most recent period. If Time direction is FORWARD, use the start of the earliest period.
- Update automatically to reflect the most recent period that has completed: If Time direction is BACKWARD, use the start of the most recent complete period. If Time direction is FORWARD, use the start of the earliest complete period.
- Set a specific time instant: Use the date from which to retrieve data as defined in the Date field.
- Time period count: The number of time periods to retrieve, such as 6 months. Default is 1.
- Trailing period type: The type of trailing period to measure data, such as Month or Quarter. This is only relevant for time-based metrics such as rates.
- Trailing period count:The number of trailing time periods to retrieve, such as 6 months. Default is 1. This option is only available when a Trailing period type is set.
- Time direction: The direction to return data, such as Backward. Default is Backward.
Snapshot query options
If you selected a snapshot query, you can set the following options to select the data that is loaded.
- Properties: The attribute to retrieve data for.
- Sort by (optional): The attribute to sort the data by.
- Sort order (optional): Whether to sort results in ascending or descending order. Default is Ascending.
- Filter by (optional): The attribute to filter the data by.
- Time period type: The type of time period to measure data, such as Month or Quarter. Default is Month.
- Date: The time instant to query from.
- Update automatically: If Time direction is BACKWARD, use the start of the most recent period. If Time direction is FORWARD, use the start of the earliest period.
- Update automatically to reflect the most recent period that has completed: If Time direction is BACKWARD, use the start of the most recent complete period. If Time direction is FORWARD, use the start of the earliest complete period.
- Set a specific time instant: Use the date from which to retrieve data as defined in the Date field.
- Time period count: The number of time periods to retrieve, such as 6 months. Default is 1.
- Time direction: The direction to return data, such as Backward. Default is Backward.
Create visualizations in Tableau
Now that you've connected your data, you can build visualizations in Tableau powered by Visier data. The following section and example provides a few options you can do to build your visualization. For more information about using Tableau Desktop, see Build Charts and Analyze Data and Build Data Views from Scratch.
Build a visualization
Let's say you want to recreate the following visual that shows the comparison of employee starts and exits for the past year in Tableau.
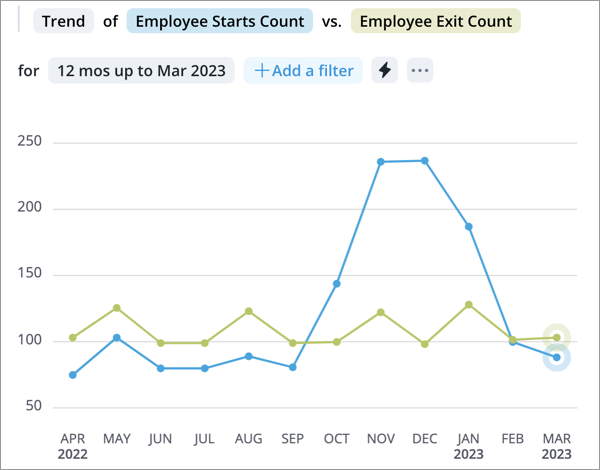
You will have to build separate queries to load this data because the metrics are associated with different analytic objects.
You will have to create the following queries to aggregate:
- Your organization's starts count over the last 12 months.
- Your organization's exit count over the last 12 months.
|
Option |
Employee Starts Query |
Employee Exit Query |
|---|---|---|
|
Analytic object |
Employment Start |
Employee Exit |
|
Query type |
Aggregate |
Aggregate |
|
Metric |
Employee Starts Count |
Employee Exit Count |
|
Time period type |
Month |
Month |
|
Date |
March 2023 |
March 2023 |
|
Time period count |
12 |
12 |
|
Time direction |
Backward |
Backward |
If you don't know what analytic object a metric belongs to, you can always add the metric in the Explore room, and check the About tab of the Info panel. We selected a time period count of 12 and a backward time direction because we want the aggregate results over the last 12 months (12 months up to March 2023).
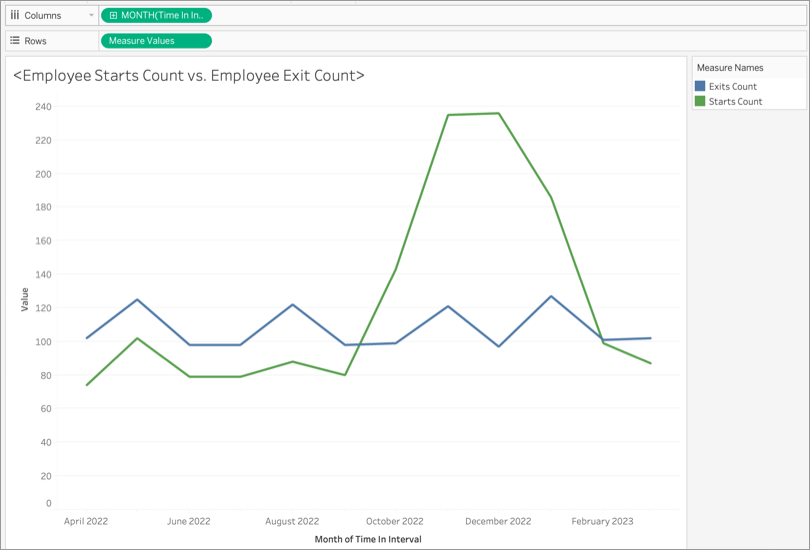
Once your Visier data is accessible in Tableau, do the following to build a visualization:
- In the Data pane of a worksheet, rename your data sources and fields in each source. In this example, let's rename our fields to Employee Starts Count and Employee Exit Count.
- Drag the Time in Interval field from the Data pane to the Columns shelf. Right-click the Time in Interval field and select Month date values as your date level. For more information, see Change Date Levels. In this example, you can use the time field from either data source because each source contains data from the same time period.
- Select the data source that contains your starts data and drag the Employee Starts Count field to the Rows shelf.
- Select the data source that contains your exit data and drag the Employee Exit Count field to the Rows shelf.
- To show multiple measures on a single axis, blend the axes, by dragging the Employee Exit Count field onto the same axis as the Employee Starts Count. For more information, see Add Axes for Multiple Measures in Views.
- For a line chart, click the Mark Type dropdown on the Marks card, and click Line. For more information, see Change the Type of Mark in the View.
By following the steps, you will end up with the following visual.
Save or publish your work
When finished building your visualization, you can save it to your local device as a Tableau Workbook file, or click the Share button in the toolbar to publish it to Tableau Server or Tableau Cloud. Either of these options retain the data at the time that you built the visualization.
Tip: To refresh your Visier data in Tableau, the next time you open the Workbook file, right-click the data source, and click Refresh. The default name for the data sources is visier_data.
Troubleshooting
If you run into errors with Visier's Tableau plugin, try the following troubleshooting methods.
|
Error message |
Troubleshooting method |
|---|---|
|
"This site can’t be reached" "Kong Error. Invalid authentication credentials." "Fetch the latest Connector version error Invalid authentication credentials" "RCIY0010016:VSE_AUTHENTICATION_INVALID_USER_OR_PASSWORD <Invalid username or password : [api_user@d3m.com]>" |
|
|
"Missing required capabilities to view data model objects." |
The Visier user must have a profile with the capability Data: API (View Level). To assign a profile to a user, see Manage the profiles assigned to a user. You can assign any profile that has at least Data: API (View Level). To check whether a profile has the correct capability, in Visier, navigate to Tenant > Profiles, select the profile, and then check the Data capability's View level. Assign the necessary data capability to the user, return to Tableau and try to authenticate again. |
|
"User has insufficient data access." |
The Visier user must have a permission with sufficient data access. To update the user's permissions, see Assign Permissions to a User. Make sure that the assigned permission gives access to the data being used in Tableau. When finished, publish the project in which you updated the user's permissions to production. For more information, see Publish Project Changes. After updating the user's data access, return to Tableau and try to authenticate again. |
|
"Query returned empty results for the selected options. Please modify options and try again." |
There may not be any data in the selected time range. Modify the selected date or time period count and then load the query again. |
|
"Query size exceeds the Maximum query size, please adjust selected data and try again." |
Reduce the query size and try again. For example, if you're building a snapshot query, remove some of the properties and try again. |
If the above methods aren't applicable to you, check your log messages, as described next.
-
Do one of the following:
Option
Do This
Check Tableau log file
- If you're using Tableau Desktop, navigate to the My Tableau Repository > Logs folder, and check the latest EPS log.
- If you're using Tableau Server, contact your Tableau Server administrator to get the EPS log.
Check browser developer console
When the Tableau plugin UI is loaded in your browser, open browser developer tools (DevTools), and check the Console tab for log messages.
- Download the file to your local device.
- Send the file to Visier for further investigation. You can send the file to Visier by filing a support case.
JSON query code samples
Selection of code samples that demonstrate the use of the JSON query builder. Copy and edit these code samples to suit your needs.
Aggregate query
This sample query loads 3 months of data for Average Direct Span of Control and Headcount filtered by Able to Remote Work employees backwards from January 1, 2023. The data is grouped by Absence Hours.
{
"query": {
"source": {
"metrics": {
"columns": [
{
"id": "wfaStructureSpanOfControlMeasure",
"columnName": "Average Direct Span of Control"
},
{
"id": "employeeCount",
"columnName": "Headcount"
}
]
}
},
"axes": [
{
"dimensionLevelSelection": {
"dimension": {
"name": "Employee.Absence_Hours",
"qualifyingPath": "Employee"
},
"levelIds": [
"Employee.Absence_Hours_level"
]
}
}
],
"filters": [
{
"selectionConcept": {
"name": "ableToRemoteWork",
"qualifyingPath": "Employee"
}
}
],
"timeIntervals": {
"fromDateTime": "2023-01-01T00:00:00.000",
"intervalPeriodType": "MONTH",
"intervalPeriodCount": 1,
"intervalCount": 3
}
}
}Snapshot query
This sample query loads 3 months of employee exit data backwards from January 1, 2023. Properties loaded include the employee ID of the employee who exited the organization, their age, and the effective date. The data is sorted in descending order by the Effective Date column.
{
"source": {
"analyticObject": "Employee_Exit"
},
"columns": [
{
"columnName": "Employee age",
"columnDefinition": {
"property": {
"name": "Employee.Age",
"qualifyingPath": "Employee"
}
}
},
{
"columnName": "Employee ID",
"columnDefinition": {
"property": {
"name": "Employee.EmployeeID",
"qualifyingPath": "Employee"
}
}
},
{
"columnName": "Effective Date",
"columnDefinition": {
"effectiveDateProperty": {}
}
}
],
"sortOptions": [
{"columnIndex": 2, "sortDirection": "SORT_DESCENDING"}
],
"timeIntervals": {
"fromInstant": "1672531200000",
"intervalPeriodType": "MONTH",
"intervalPeriodCount": 1,
"intervalCount": 3
}
}SQL-like query code samples
You can specify a SQL-like query for Visier's Data Query API to retrieve results. For more information, see /v1/data/query/sql in API Reference.
This sample query loads 3 months of data for Headcount backwards from April 1, 2020.
SELECT employeeCount() AS Employee_Count,Visier_Time AS Reporting_Period
FROM Employee
WHERE Visier_Time IN periods(date("2020-04-01"), 4, period(3, Month))This sample query loads 3 months of data for Headcount backwards from April 1, 2020 with options (additional instructions to perform the query) such as hiding zeros in the result.
{
"query":"SELECT employeeCount() AS Employee_Count,Visier_Time AS Reporting_Period FROM Employee WHERE Visier_Time IN periods(date(\"2020-04-01\"), 4, period(3, Month))",
"options":{"zeroVisibility":"HIDE","nullVisibility":"HIDE","enableSparseResults":true,"memberDisplayMode": "COMPACT","internal":{"alignTimeAxisToPeriodEnd": true}}
}TACO file history
Download the VisierData.taco file.
|
Version |
Last updated date |
Changes |
|---|---|---|
|
1.1.2 |
April 16, 2025 |
|
|
1.1.0 |
May 10, 2024 |
|
|
1.0.0 |
December 18, 2023 |
|